No price shown online — add this to your list and we'll quote you based on the quantity you need.
Prefer to talk it through? Contact us or WhatsApp directly.
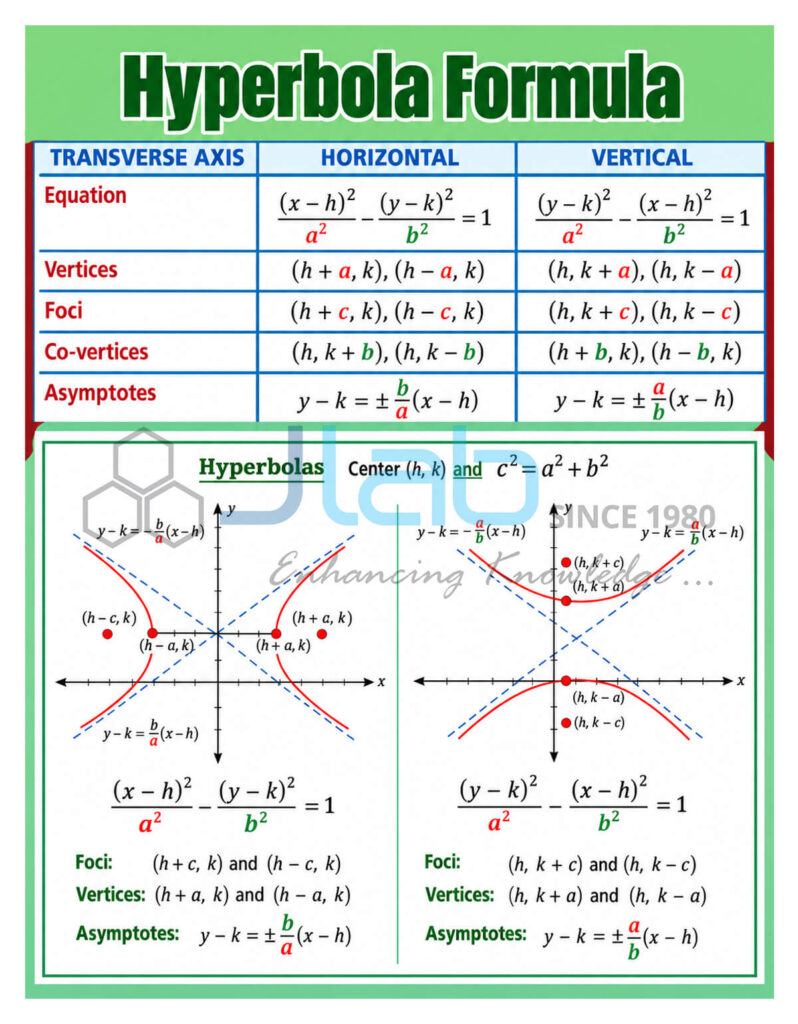
The Hyperbolas Wall Chart is a comprehensive mathematics learning resource that explains the properties, transformations, and graphical behaviour of hyperbolic functions using the standard equation y = a/(x + p) + q. Designed for secondary school mathematics learners, teachers, tutors, and homeschooling environments, this educational wall chart presents the key concepts of hyperbolas in a structured and easy to understand format.
A clear reference table describes how the value of a determines the shape of the graph and the quadrants in which the branches appear. It also explains how p controls the horizontal shift of the graph and how q determines the vertical shift, allowing students to understand how changing each constant affects the position of the curve on the Cartesian plane.
Ideal for classrooms, mathematics laboratories, tutoring centres, and home study spaces, this educational wall chart serves as a valuable mathematics poster that supports visual learning and independent revision.